Case study 02 · Web portal · Impact measurement · 2019
Datacom: The Big Shift
A web portal that helps organisations across New Zealand measure, analyse and report on their social, economic, environmental and cultural (SEEC) impact in one place.
- Role
- UX research, UX/UI design
- Challenge
- Make a complex, four-dimensional impact framework feel simple and customisable for enterprises, communities and small businesses alike.
- Duration
- January to April 2019 (17 weeks)
- Tools
- Figma, Google Forms, AI tooling
- Audience
- Organisations; users aged 18 to 60

01 · What is it?
ConductedOverview
The Big Shift is a web portal designed to let enterprises and communities across New Zealand measure their social, economic, environmental and cultural (SEEC) impact. By giving them one comprehensive, user-friendly platform, the project aimed to help organisations track and improve their contribution in these areas.
The project ran from January to April 2019 (17 weeks), following a design-thinking process: empathise, define, ideate, design and test.
02 · What does the portal look like?
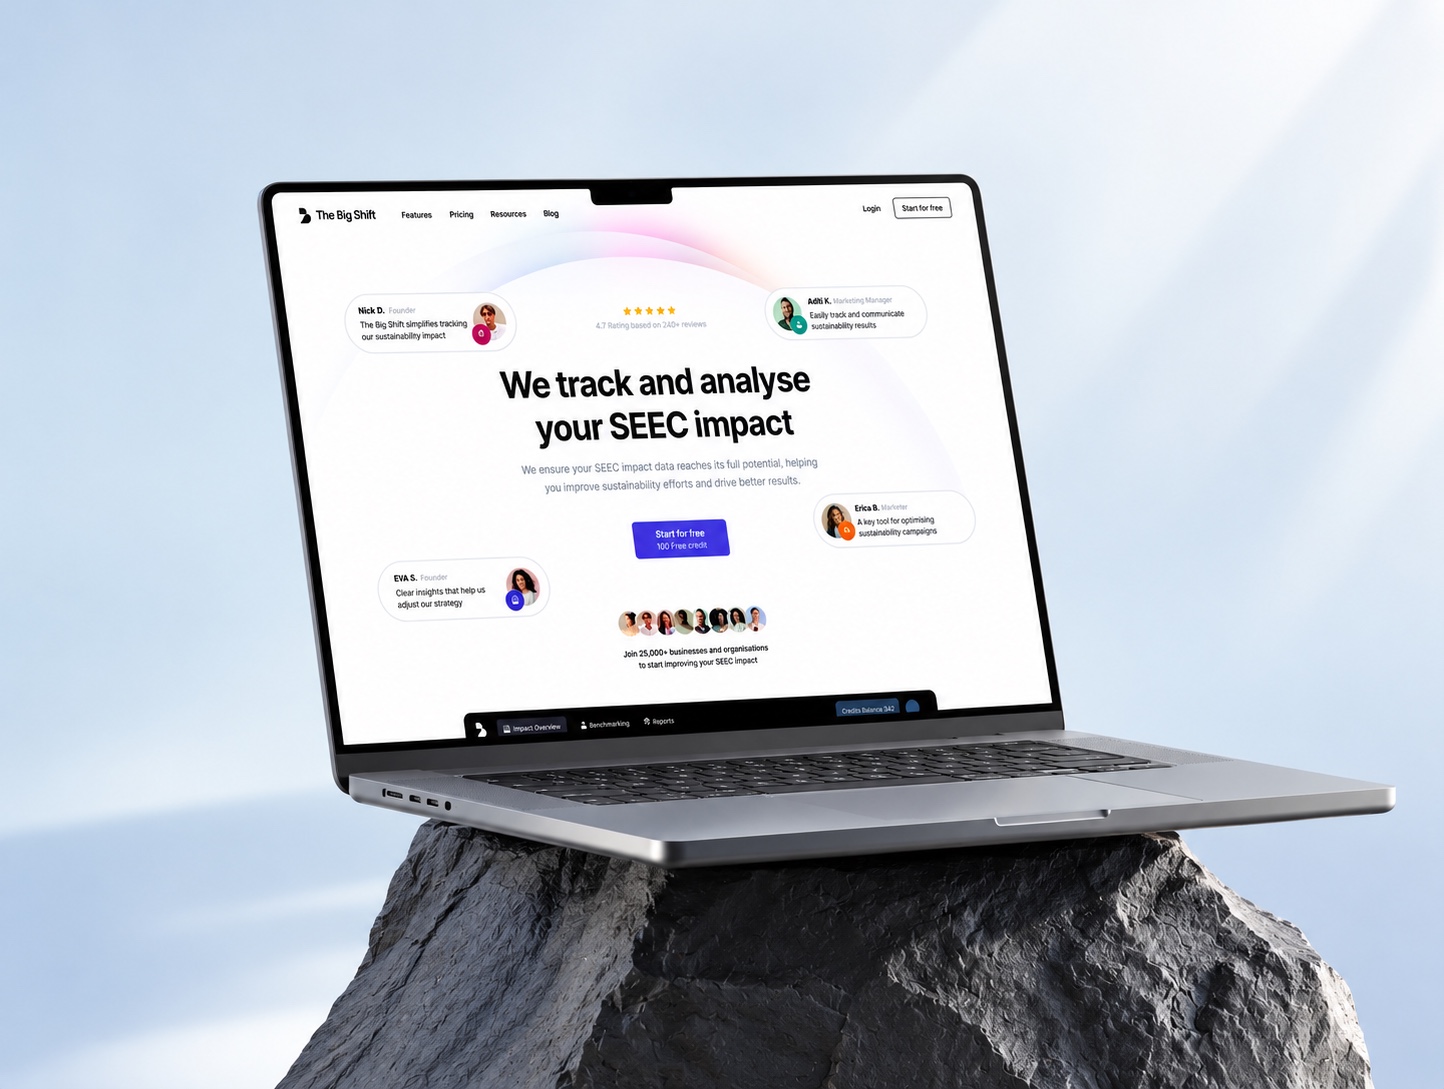
ConductedThe home page
The home page states the value in one line, “We track and analyse your SEEC impact”, and leads to a single sign-up action. The navigation covers features, pricing, resources and the blog, and the signed-in view adds impact overview, benchmarking and reports.
03 · What needed solving?
ConductedProblem and solution
Target audience: people aged 18 to 60.
The problem
Organisations in New Zealand lacked a unified way to measure their SEEC impact. Existing methods were fragmented, leading to inconsistent reporting, difficulty assessing progress and little insight into how to improve. They needed streamlined data collection, useful analytics and better decision-making.
The solution
A one-stop portal to measure, analyse and report on SEEC contributions, with tailored dashboards, actionable insights and reporting tools. It also supports alignment with national goals for sustainability and cultural preservation.
04 · Would organisations use it?
ConductedQuantitative research
An online survey (Google Forms) of around 8 users explored how the portal could help organisations measure, analyse and report on SEEC contributions, including communication efficiency, bounce rates and overall experience.
With a sample this small the results are directional rather than statistically representative. Readiness to integrate the portal into existing practice (50%) was the lowest score, which pointed to onboarding and ease of adoption as the main design risk.
Will the portal help your organisation better understand and measure SEEC contributions?
75%Yes · 25% NoIs your organisation prepared to integrate the portal into current sustainability practices?
50%Yes · 50% NoWill the actionable insights be useful for informing strategic decisions?
85%Yes · 15% NoDo the reporting tools align with your sustainability and cultural goals?
70%Yes · 30% NoIs your organisation likely to use the portal regularly for reporting?
80%Yes · 20% NoDo you believe the portal will provide long-term value to your organisation and community?
90%Yes · 10% No
05 · Who is it for?
ConductedPersona
James Carter stands in for small-business owners who care about sustainability but need it to be affordable, explainable to customers and workable alongside growth.
James Carter
36 · Business owner, sustainable products company
Founder and CEO of a small business that specialises in eco-friendly, sustainable products.
- Creative
- Environmental
- Productive
- Curious
Values and motivations
Deeply committed to reducing his carbon footprint and promoting sustainability. He believes in ethical consumerism, leads by example, and wants to make a tangible impact and inspire others to adopt more eco-friendly lifestyles.
Technology comfort
IT and internet · Software · Mobile apps · Social networks
Goals
- Expand his business and increase awareness of sustainable products
- Incorporate renewable energy and reduce waste in operations
- Set an example for his child about caring for the planet
Expectations and needs
- Cost-effective sustainability, so the business can grow without compromising values
- Tools to educate customers on the long-term value of sustainable products
- A dependable supply of sustainable materials that meet ethical and quality standards
Pain points and objections
- Scaling sustainability: balancing growth with eco-friendly practice at higher cost
- Consumer education: convincing customers to choose sustainable over cheaper alternatives
- Supply chain: sourcing consistent, high-quality sustainable materials
06 · Where is the gap?
ConductedCompetitor analysis
Three established frameworks shaped the positioning: B Impact Assessment, GRI Standards and SASB. Each is strong in its niche, but none covers cultural impact or offers customisable, interactive tracking for communities and small businesses. This reflects the market as assessed during the project, not a current review.
| B Impact Assessment | GRI Standards | SASB | The Big Shift | |
|---|---|---|---|---|
| Focus areas | Social, environmental | Social, economic, environmental | Environmental, social, governance (ESG) | Social, economic, environmental, cultural |
| Target users | Businesses seeking B Corp certification | Large corporations and institutions | Investors and corporations with an ESG focus | Enterprises, communities, small businesses |
| Key differentiator | Certification-focused, structured assessment | Compliance-based reporting | Financial materiality focus for investors | Holistic impact tracking across all SEEC areas |
| UX/UI strengths | Clear data visualisation, guided assessments | Structured reporting framework | Investor-oriented, clear focus | Easy-to-use, customisable dashboards with real-time tracking |
| UX/UI weaknesses | Rigid for non-B Corp companies | Text-heavy, difficult navigation | Limited interactivity for non-investors | Not assessed in the source table |
| Customisation | Moderate: structured assessment | Low: standardised reports | Low: primarily financial materiality | High: tailored to industries and community types |
| Interactivity | Medium: survey-based assessments | Low: document-based reporting | Low: report-focused | High: dynamic, interactive features |
| Best for | Businesses aiming for B Corp certification | Large corporations with global reporting needs | Investors and public companies focused on ESG | Enterprises, communities and small businesses tracking broader impact |
B Impact Assessment
Strengths
- Clear and visually engaging data presentation
- Step-by-step guided assessment
Weaknesses
- Limited flexibility for businesses not aiming for B Corp
- Few interactive features for deeper engagement with data
GRI Standards
Strengths
- Standardised, globally recognised ESG reporting
- Structured, comprehensive approach
Weaknesses
- Text-heavy, complex documentation
- Rigid structure for smaller or more agile companies
SASB
Strengths
- Focus on financially material factors for investors
- Clear focus on the financial impact of ESG issues
Weaknesses
- Designed for investors, limited for other stakeholders
- Few interactive tools for non-financial aspects
The Big Shift
Strengths
- Covers social, economic, environmental and cultural impact
- Highly customisable for enterprises, communities and small businesses
Weaknesses
- Still in development, so the experience may evolve as it scales
- High customisation may overwhelm users who want something simpler
07 · What does the user need to feel?
HypothesisEmpathy map
The map frames James's thinking and feelings: optimistic about a single place to track everything, but anxious about the time to learn a new tool. That tension shaped the priority on simple onboarding and a clear dashboard.
Says
- “We need a way to track and measure our impact on the community and environment.”
- “It's hard to find all the right data and insights in one place.”
- “I want to see how we can make a difference and improve our contributions.”
- “Tracking our impact should be easy and accessible for everyone in the organisation.”
Thinks
- “How can we make sure we're contributing positively to all four areas?”
- “If we don't measure it, how will we know if we're improving?”
- “This platform could streamline our efforts and help us stay accountable.”
- “Is this tool user-friendly enough for everyone on the team?”
Feels
- Overwhelmed by the complexity of tracking multiple impact areas
- Optimistic about the potential for positive change
- Anxious about the time it takes to learn a new tool
- Encouraged by one platform to track everything in real time
Does
- Inputs and tracks SEEC data on the platform
- Engages team members for better transparency
- Reviews reports to assess progress and areas to improve
- Shares insights with stakeholders to showcase sustainability efforts
08 · How does it hold together?
ConductedInformation architecture
Seven areas sit under one product, built around the dashboard as the daily hub and impact tracking organised by the four SEEC dimensions.
The Big Shift
Home page
- Overview of the platform
- Key features and benefits
- Call to action: sign up or log in
- Testimonials and success stories
- Contact and support
User authentication
- Sign up
- Log in
- Forgot password
Dashboard
- Impact overview (SEEC score summary)
- Quick actions: add impact data, view reports, set goals, explore insights
- Personalised recommendations
Impact tracking
- Social: community engagement, employee well-being, charitable contributions
- Economic: business growth metrics, local economy contributions
- Environmental: carbon footprint tracking, sustainability initiatives
- Cultural: diversity and inclusion efforts, cultural preservation projects
Goal setting and progress tracking
- Set measurable impact goals
- Track progress over time
- Receive suggestions for improvement
Reports and insights
- View SEEC reports
- Download reports (PDF, CSV)
- Compare historical data
- Benchmark against industry standards
Account and settings
- User profile (update details)
- Organisation settings (company information, team members)
- Notification preferences
09 · What is the main journey?
ConductedUser flow
From sign-up to the dashboard, a user starts an impact assessment and takes one of two paths: view results and set goals, or fill out the impact form and explore recommended resources. The two paths feed into each other.
Start, then Home page, then Sign up or Log in (with a Forgot password side branch), then Dashboard, then Start impact assessment. From there, either View results then Set goals and milestones, or Fill out impact form then View recommendations then Explore resources. Set goals and milestones and Explore resources link to each other.
10 · How do the key pages work?
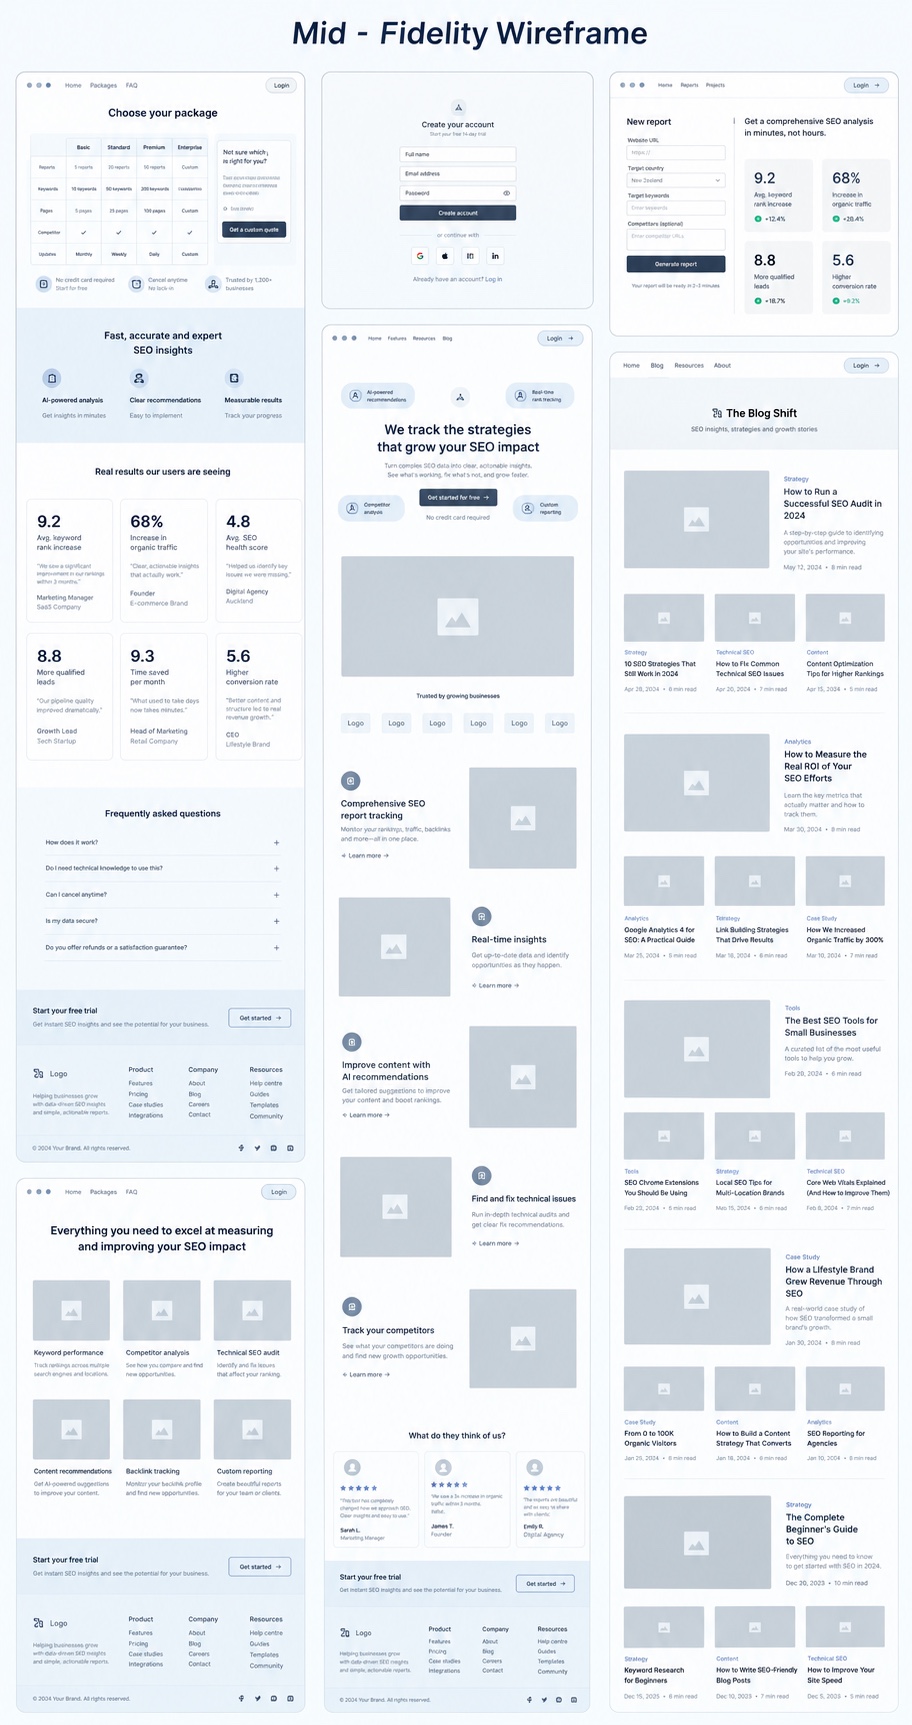
ConductedMid-fidelity wireframes
Mid-fidelity wireframes lay out the portal's key pages before any visual design: choosing a package, creating an account, generating a report, the landing page and the blog, built from repeatable components such as cards, metric tiles, testimonials, a FAQ and a footer.
11 · What did it become?
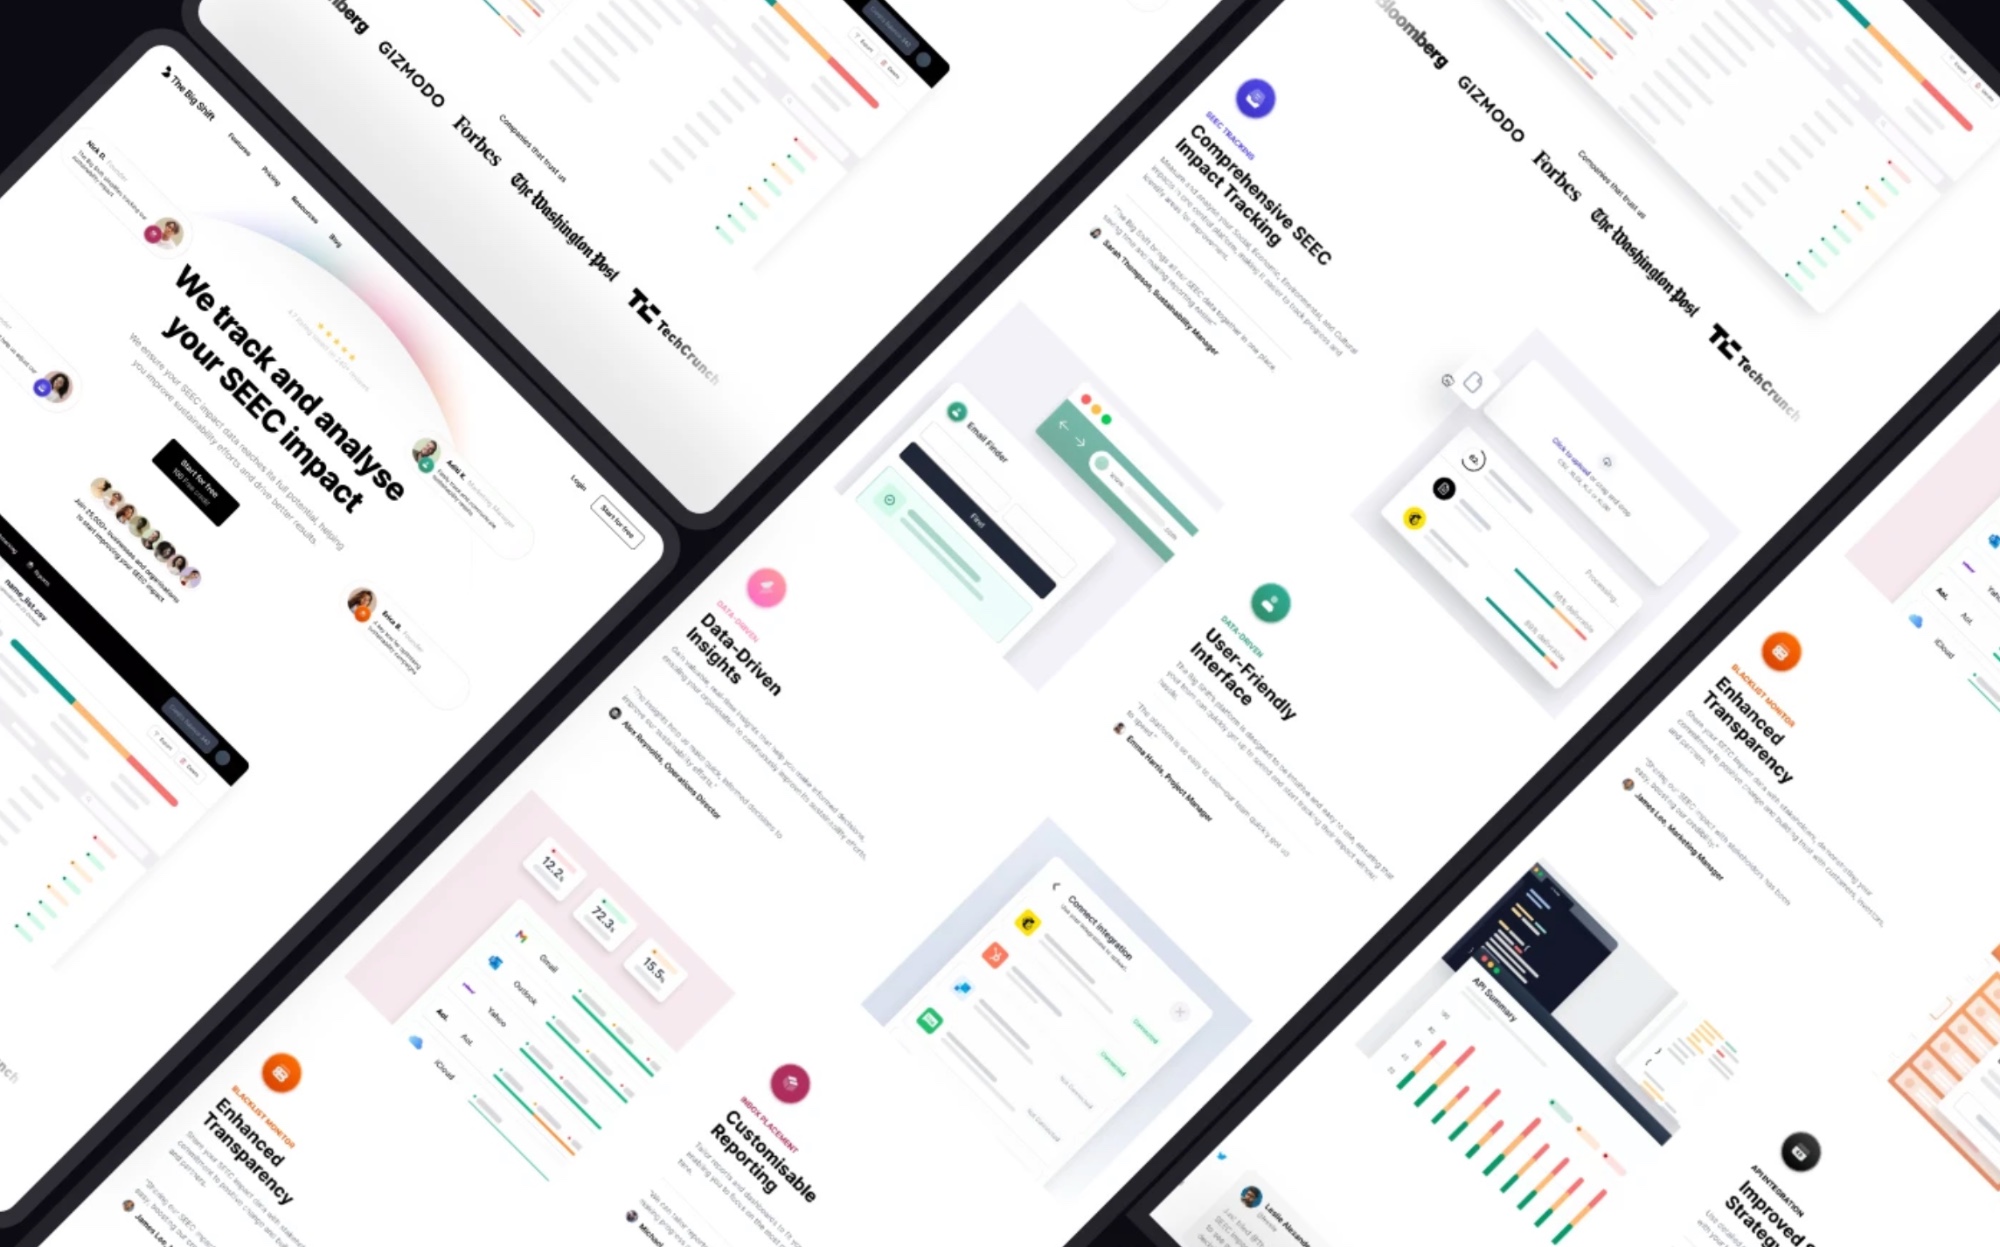
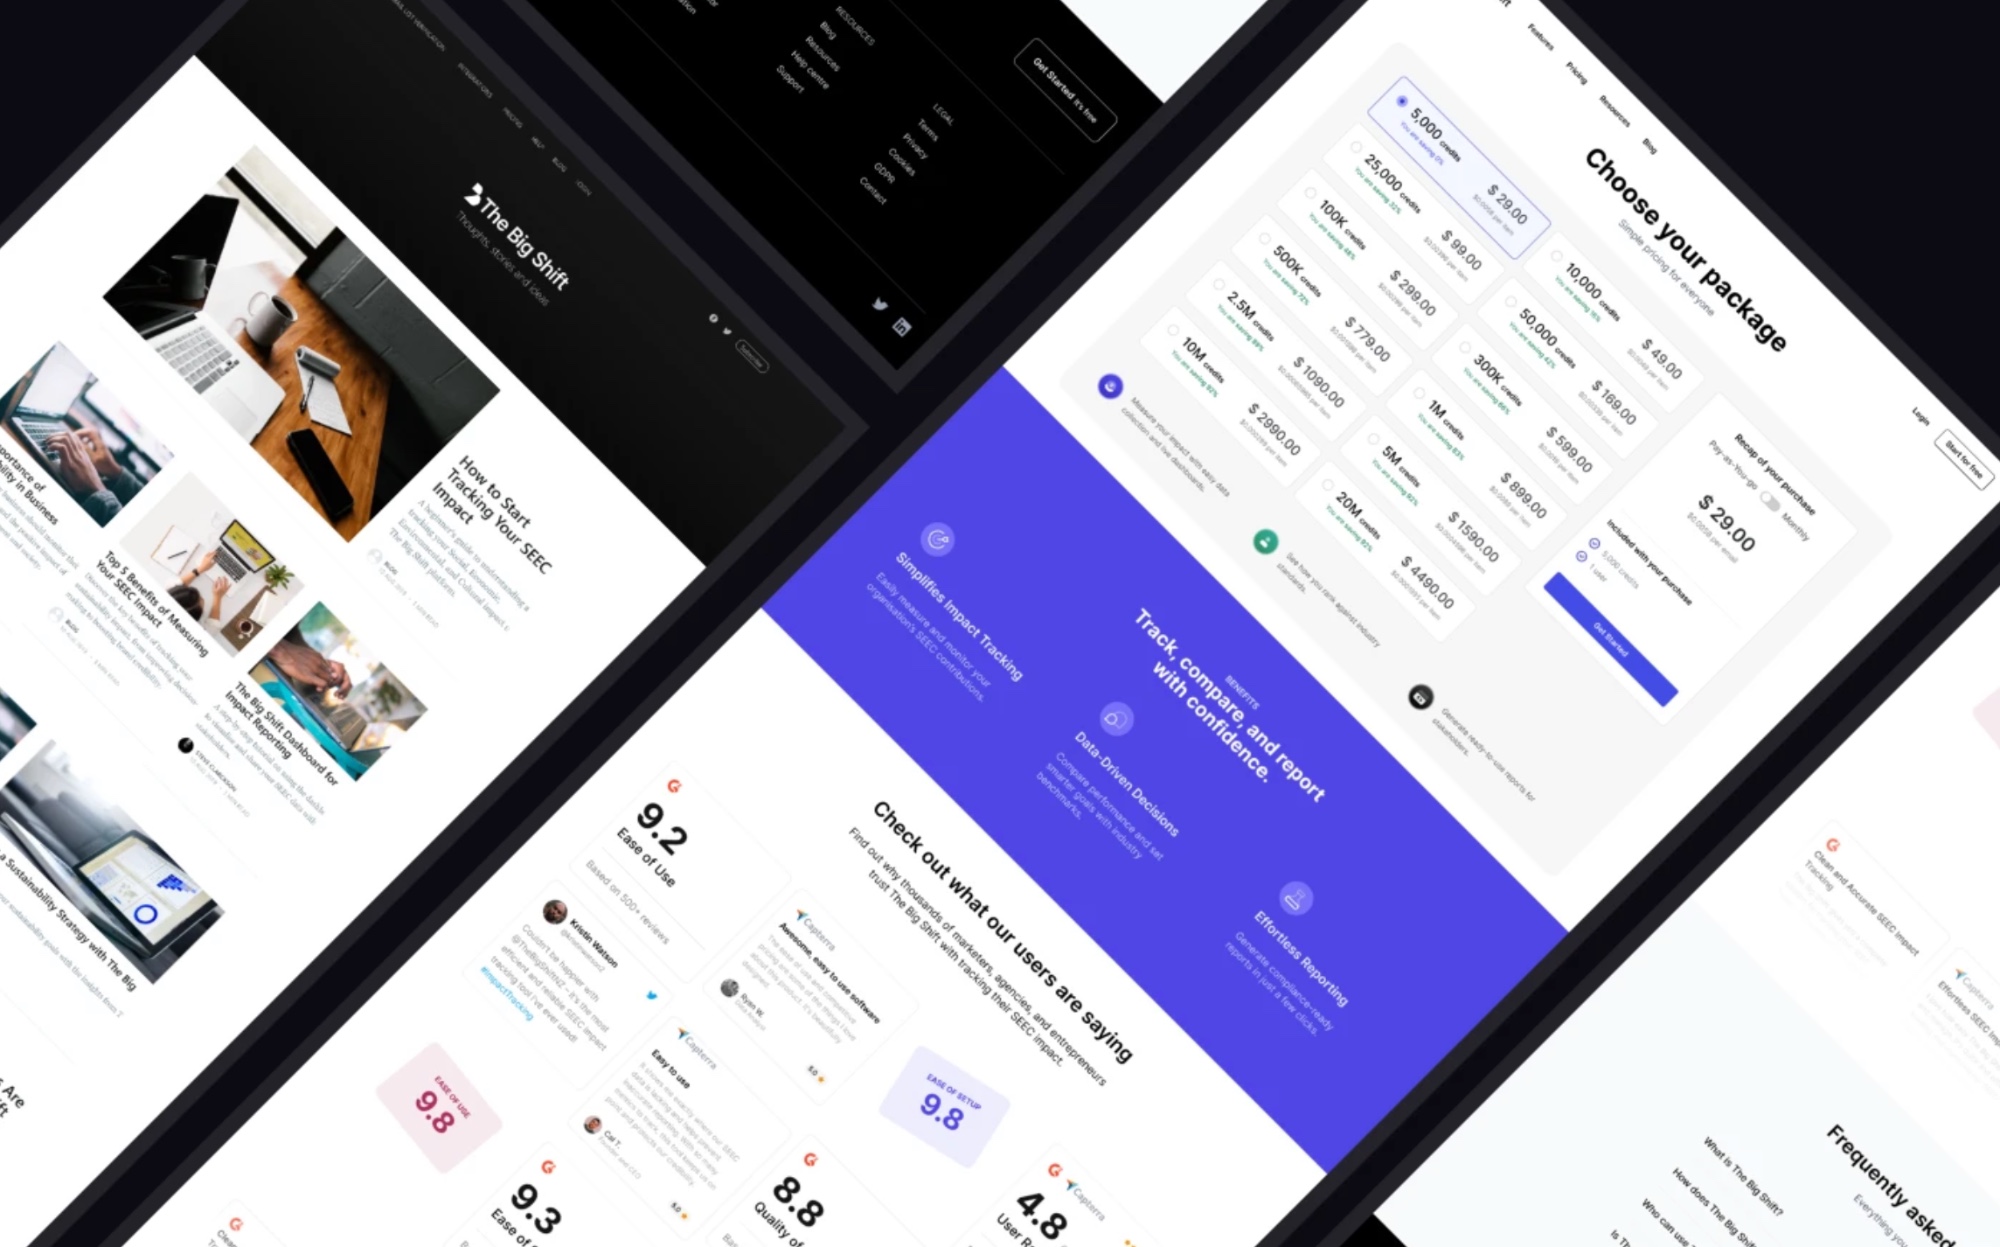
ConductedFinal design
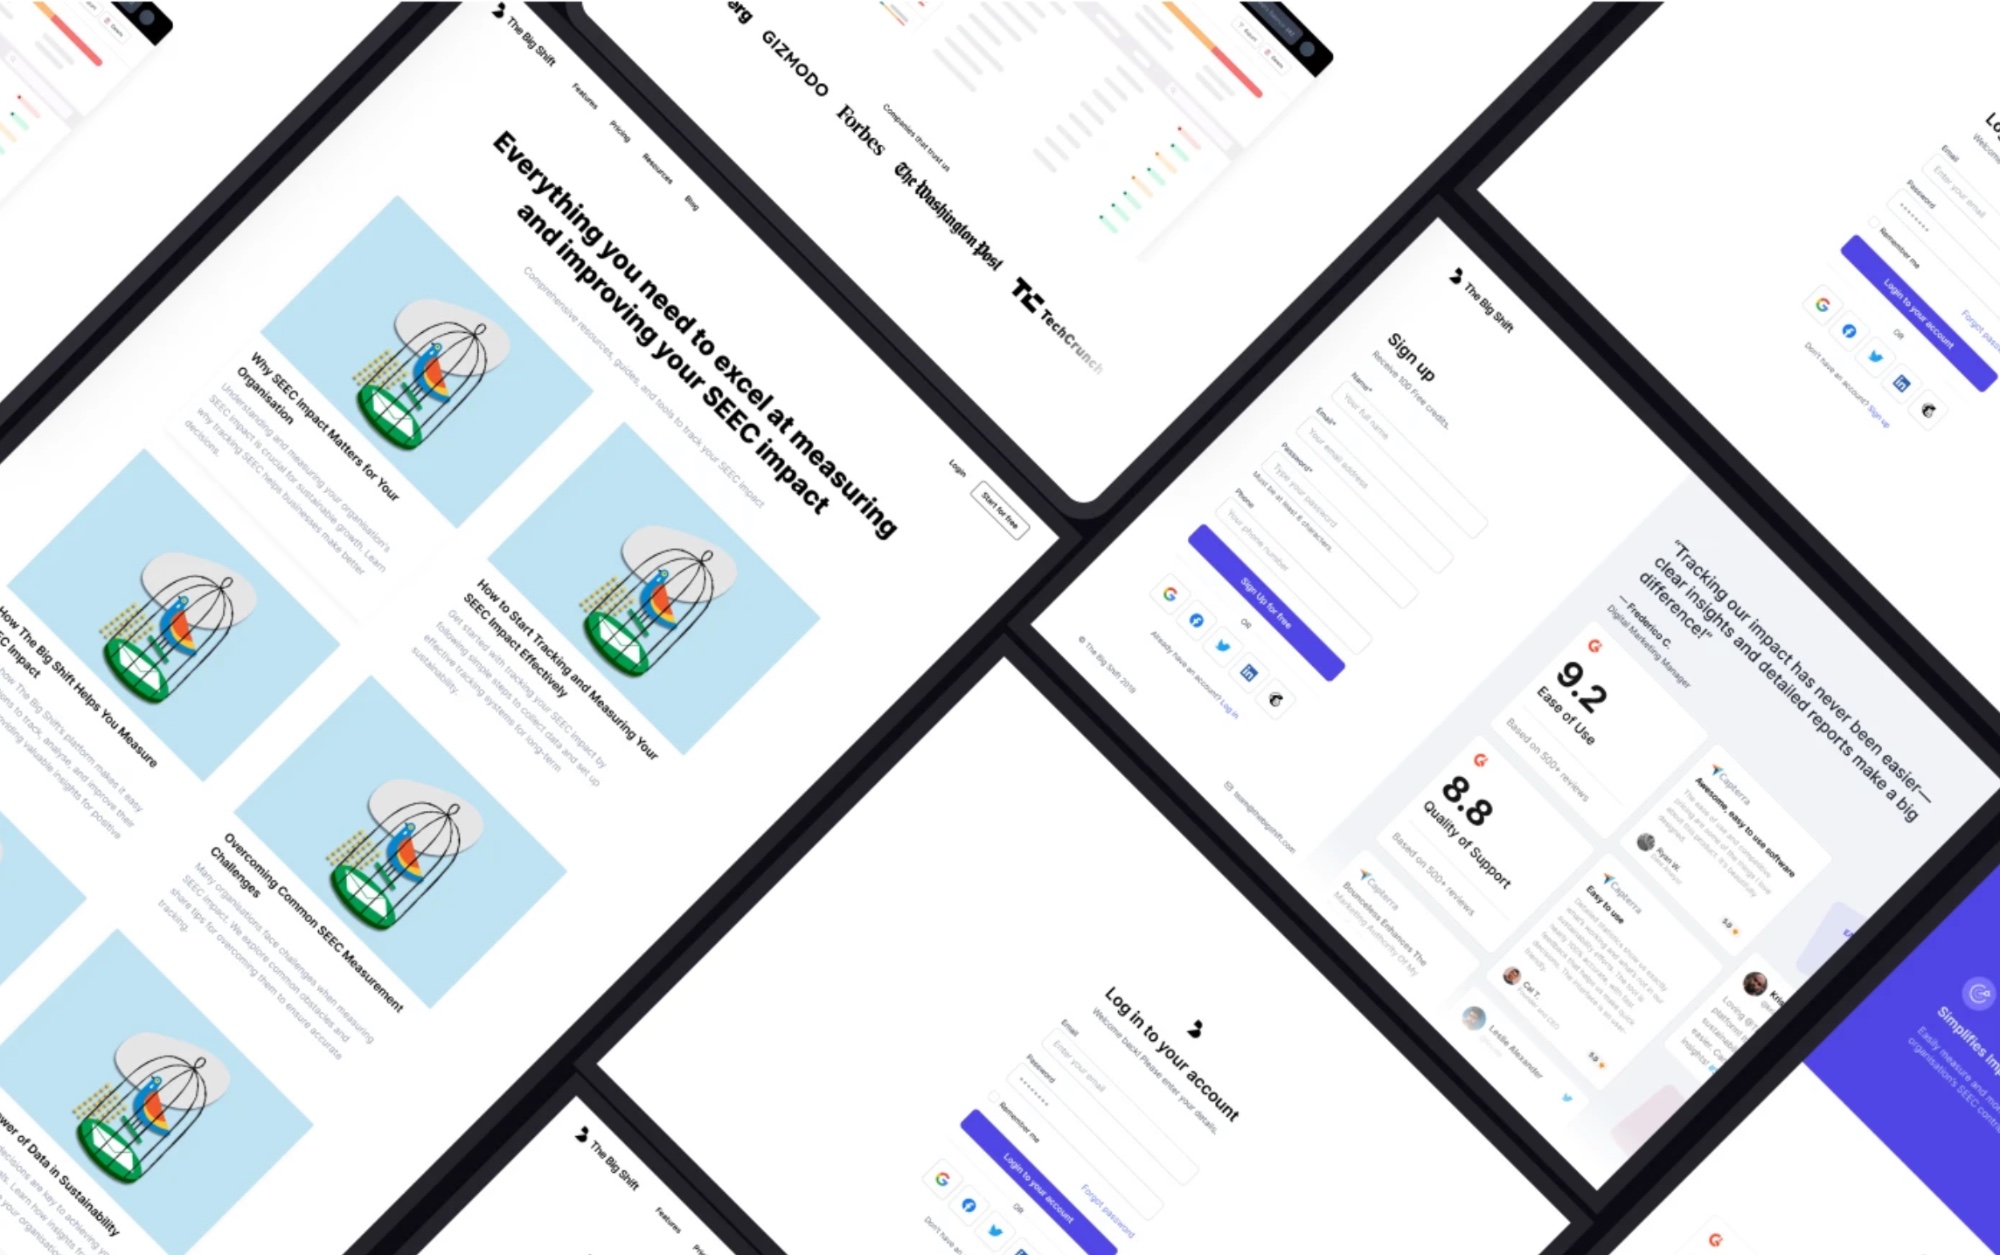
The finished interface across the portal: the landing page and feature sections, the blog, package selection and benefits, and the resources, sign-up and log-in screens. Press logos, ratings and testimonials shown are placeholder content.
12 · How is it kept consistent?
ConductedStyle guide
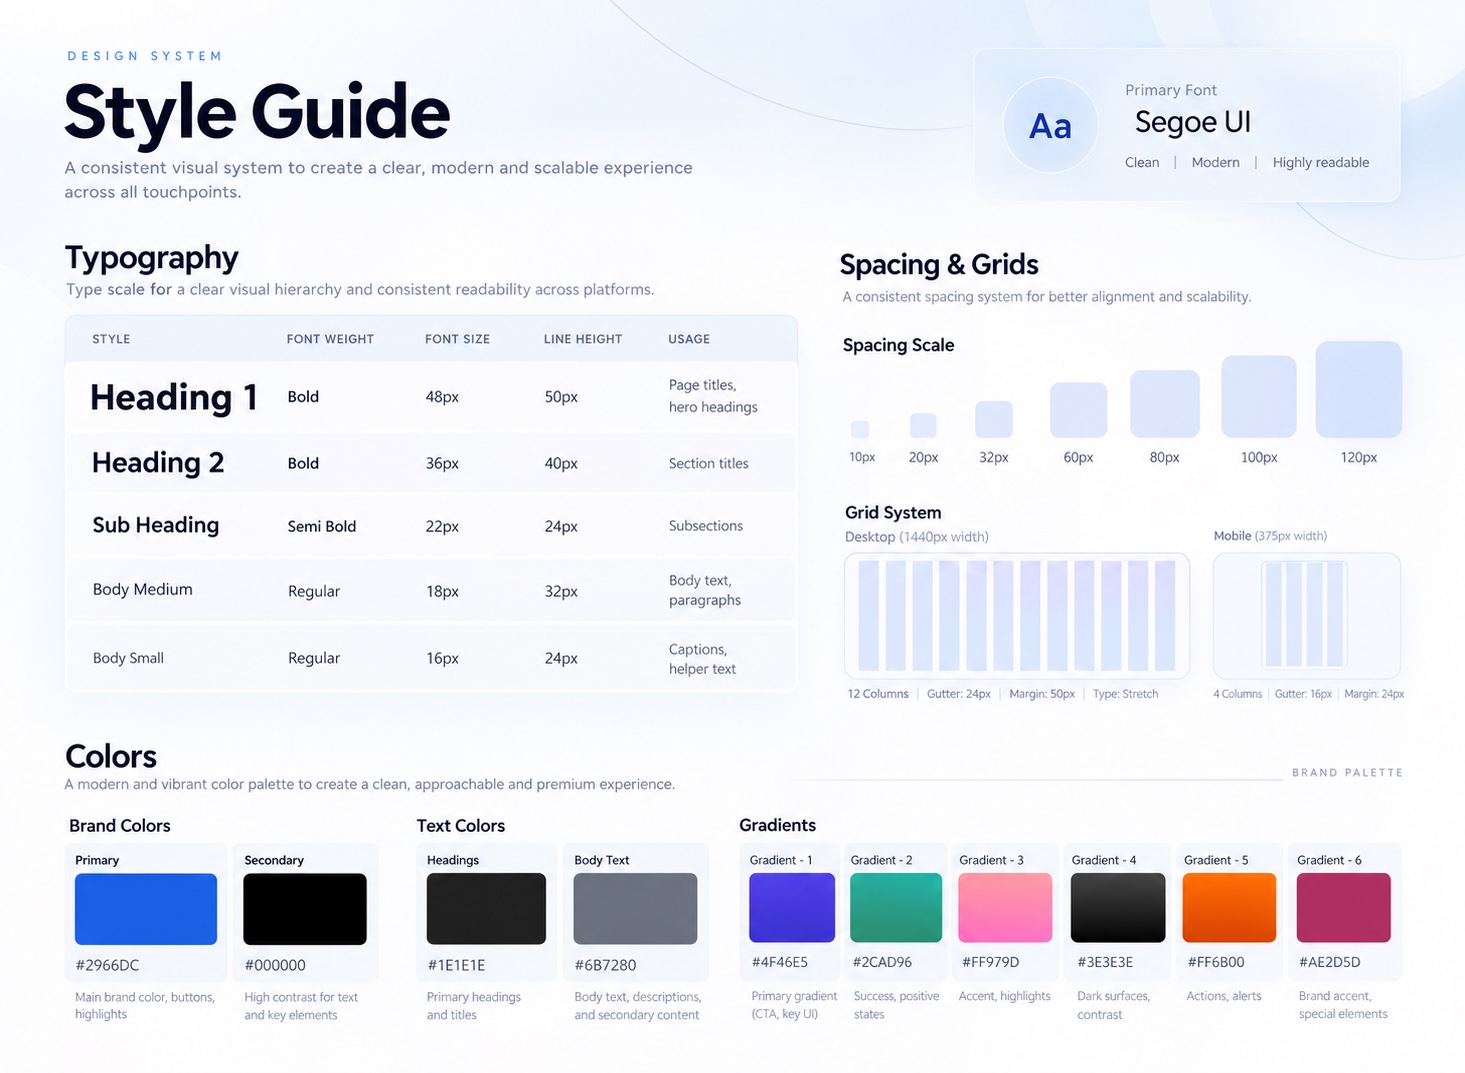
A compact design system documents type, spacing, grid and colour, so screens built by different people stay consistent.
Outcomes
What came out of it.
- Demonstrates
A full research-to-structure process: survey, persona, competitor analysis, empathy map, information architecture, user flow and a documented style guide, delivered over 17 weeks.
- Reported
In a small survey of around 8 users, 90% said the portal would provide long-term value and 85% said its insights would inform strategic decisions.
Next case study
Luniby: triage that calms owners and unblocks clinics
Read nextWorking on something similar?
Get in touch